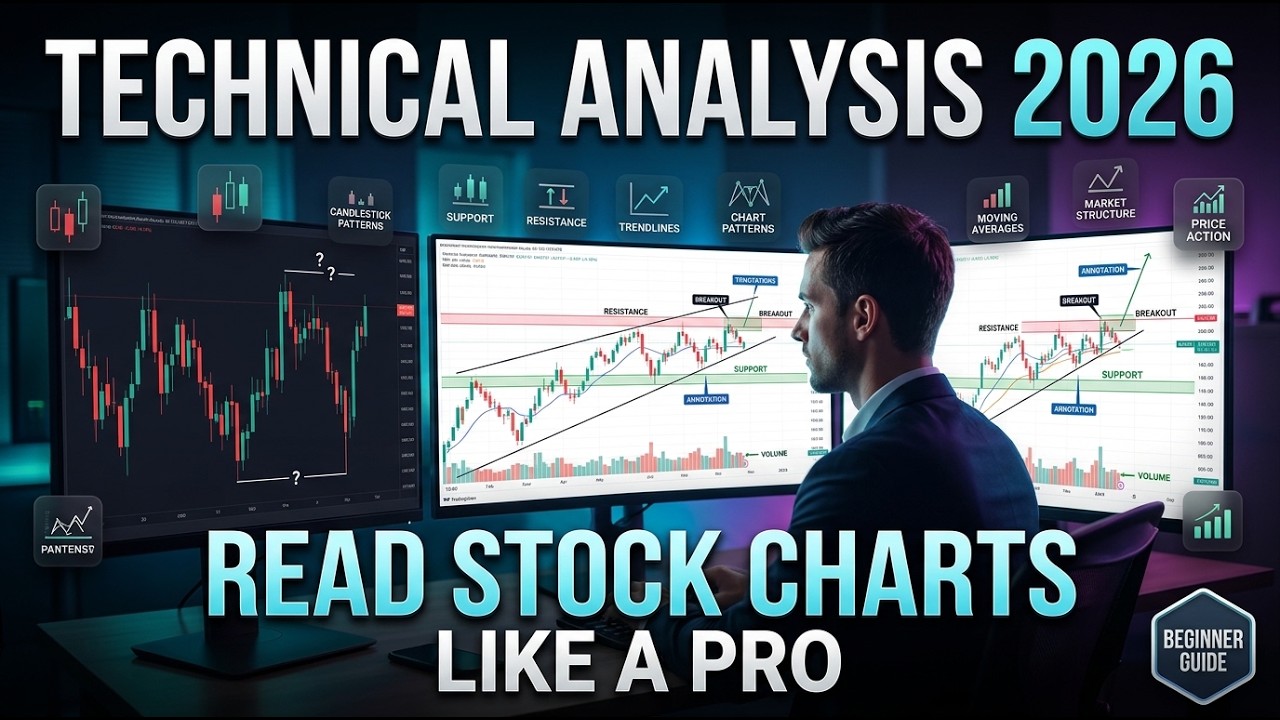
Technical Analysis for Beginners 2026 | Learn to Read Stock Charts Like a Pro
? Stay Connected:
? Subscribe Now & Start Your Web Development Journey Today!
? [https://www.youtube.com/channel/UCqLYJkKUl5WqdlsoU_5Q9IQ]
Technical Analysis for Beginners 2026 | Learn to Read Stock Charts Like a Pro
Learn Technical Analysis for Beginners 2026 with this complete guide to reading stock charts and understanding the fundamentals of market analysis. This course is designed for beginners who want to understand how price charts work, how to identify trends and patterns, and how technical indicators can be used as part of a structured market analysis process.
In this Technical Analysis 2026 tutorial, you will learn how to read stock charts from the ground up and understand the information presented by candlesticks, price movements, trends, support and resistance levels, chart patterns, volume, and technical indicators.
Whether you are completely new to stock market analysis or want to strengthen your existing chart-reading skills, this beginner-friendly course provides a structured introduction to the most important concepts used in technical analysis.
What You Will Learn
Technical analysis fundamentals
How to read stock charts
Understanding candlestick charts
Bullish and bearish price movements
How to identify market trends
Uptrends, downtrends, and sideways markets
Support and resistance levels
Trendlines and price channels
Basic chart patterns
Understanding trading volume
Moving averages
Relative Strength Index (RSI)
MACD and momentum indicators
Technical indicators explained for beginners
Price action fundamentals
Identifying potential market setups
Multiple timeframe analysis concepts
Risk management fundamentals
Common technical analysis mistakes
How to build a structured chart analysis process
You will also learn how different technical analysis tools can work together rather than relying on a single indicator or pattern. The goal is to help you develop a better understanding of price behavior and create a more organized approach to analyzing stock charts.
This Stock Chart Reading 2026 course is suitable for beginners, aspiring traders, investors who want to understand chart-based analysis, and anyone interested in learning technical analysis from scratch.
Technical analysis is a framework for studying historical price and volume information. It does not guarantee future market results, and real-world market decisions involve uncertainty and risk. Use the concepts in this course as educational foundations and develop your skills through careful study and practice.
Start learning Technical Analysis in 2026 and build a strong foundation in stock chart reading, candlestick analysis, trends, support and resistance, chart patterns, and technical indicators.
SEO Keywords: Technical Analysis for Beginners 2026, technical analysis, stock chart reading, how to read stock charts, technical analysis course, technical analysis tutorial, stock market technical analysis, stock charts for beginners, technical indicators, candlestick analysis, price action, support and resistance, chart patterns, stock trading analysis, technical analysis 2026.

Full Course
This channel is about full courses any type of Content Software So Subscribe For Upcoming New Fully Free Course By Full course....