Metric Pipeline for Kubernetes (Free Labs)
? Practice free in our Kubernetes labs: https://kode.wiki/4vIb1Z9
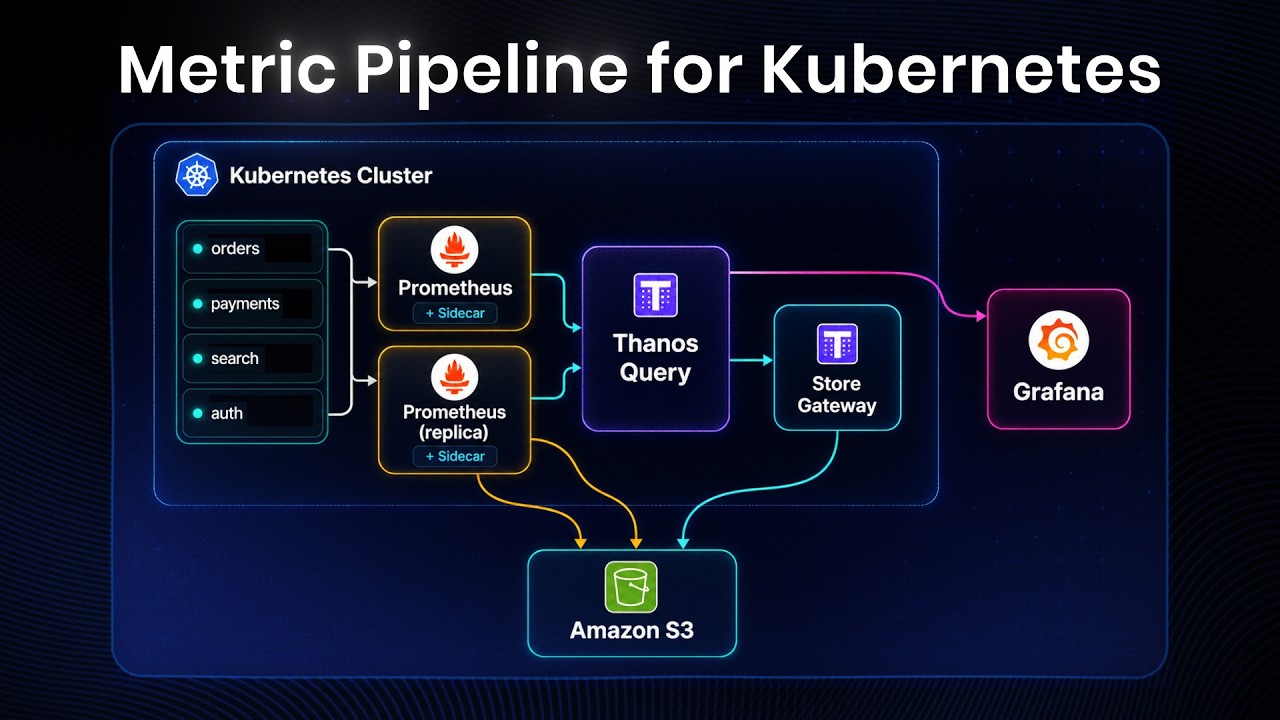
Ever wondered how big platforms monitor 100+ microservices without losing a single metric? In this video we design a complete Kubernetes monitoring pipeline using Prometheus, Thanos, and Grafana, with Amazon S3 as cheap, unlimited long-term storage.
We connect the full stack together: Prometheus, Thanos Sidecar, Store Gateway, Thanos Query, Compactor, and Grafana. We break down exactly what each component does and why a single Prometheus pod can never scale on its own, no jargon.
? By the end of this video you'll understand:
?How Prometheus scrapes and stores metrics in blocks
?Why local disk retention becomes a bottleneck at scale
?How Thanos Sidecar ships sealed blocks to S3
?How Store Gateway and Thanos Query merge fresh and historical data
?How Grafana visualizes everything from one place
? Don't just watch it, build it. Open the free lab and build this exact pipeline step by step in a real Kubernetes playground: https://kode.wiki/4vIb1Z9
⏰ Timestamps below ?
00:00 - Why Metrics and Logs Matter (The Problem at Scale)
00:50 - How Prometheus scrapes data and stores data?
02:32 - Thanos Sidecar (The Shipper)
03:49 - Store Gateway (Querying S3 Blocks)
04:17 - Thanos Query (The Single Front Door)
04:41 - Grafana (The Dashboard)
05:20 - Compactor
05:48 - Build It Yourself + Free Lab
? Subscribe for more system design breakdowns you can actually build yourself.
#Kubernetes #Prometheus #Thanos #Grafana #SystemDesign #Monitoring #Observability #DevOps #SRE #AmazonS3 #CloudNative #KubernetesMonitoring #PromQL #Microservices #PlatformEngineering #CloudComputing #DevOpsEngineer #KodeKloud

KodeKloud
...